
Page 30 - 1
P. 30
Open Microsoft Excel worksheet which you had used in the previous
topic. Now move the chart made in the worksheet to a new area so that it
I am is clearly visible. Save and exit the worksheet.
Gizo.
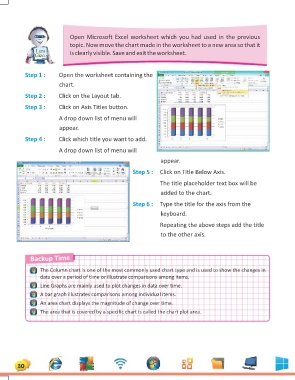
Step 1 : Open the worksheet containing the
Step 2 : chart.
Step 3 :
Click on the Layout tab.
Step 4 :
Click on Axis Titles button.
A drop down list of menu will
appear.
Click which title you want to add.
A drop down list of menu will
appear.
Step 5 : Click on Title Below Axis.
The title placeholder text box will be
added to the chart.
Step 6 : Type the title for the axis from the
keyboard.
Repeating the above steps add the title
to the other axis.
Backup Time
The Column chart is one of the most commonly used chart type and is used to show the changes in
data over a period of time or illustrate comparisons among items.
Line Graphs are mainly used to plot changes in data over time.
A bar graph illustrates comparisons among individual items.
An area chart displays the magnitude of change over time.
The area that is covered by a specific chart is called the chart plot area.
30